Pre-specified hypotheses, nulls, and the monitoring protocol
The thesis becomes research only when the unit, horizon, metric, null, and disconfirming observation are specified before the outcome. Broad propositions remain exploratory until they meet that standard.
Seven primary hypotheses are designed for review through 2030. A primary hypothesis can be supported, unchanged, weakened, or rejected; it cannot be rescued by switching to another channel or scenario. The event definitions below identify observations that trigger measurement, not outcomes that automatically confirm the claim.
Executable hypotheses and adjudication states
Protocol definitions remain fixed through the first quarterly cycle. Primary frontier firms are SpaceX/xAI, OpenAI, Anthropic, and future firms whose principal strategic identity is a frontier model, frontier application, or integrated frontier platform. Material AI-system issuers are public companies whose index weight and direct control of a critical AI-stack layer can transmit AI-related shocks; NVIDIA qualifies at the baseline. H1A uses the material AI-system issuer universe, not the narrower primary-firm label. A material index weight is at least 1.0 percent in the S&P 500 or Nasdaq-100. A major infrastructure project is at least 1 GW or $10 billion of committed capital. Comparator membership, thresholds, event IDs and endpoints are frozen before each trigger.
Quarterly reviews are observation updates, not repeated endpoint tests. Temporal gating occurs first: no qualifying event means not triggered; a qualifying event whose observation window remains open is reported as window open. At the endpoint, verdict precedence is mandatory-evidence failure -> not adjudicable; simultaneous support and null satisfaction -> mixed; support only -> support; null only -> null; neither -> mixed/indeterminate. Missing treated or comparator data never create support. Formal statistical inference, if later added, must pre-specify the test family and repeated-look control.
| State | Meaning | Permitted conclusion |
|---|---|---|
| 1. Not triggered | No qualifying event has occurred. | Baseline monitoring only. |
| 2. Triggered; window open | A qualifying event occurred, but the formal observation horizon has not ended. | Interim facts may be reported; no support or rejection verdict. |
| 3. Support threshold met | All mandatory support conditions satisfy the fixed Boolean rule at the endpoint. | Support for that hypothesis only; no inference to other channels. |
| 4. Null threshold met | The affirmative rival/null conditions satisfy their fixed rule. | The tested mechanism is weakened or rejected for that event. |
| 5. Mixed or indeterminate | At the endpoint, support and null both hold, conflict, or neither complete rule is met. | Retain uncertainty. Do not score partial movement as support or null. |
| 6. Not adjudicable | Mandatory treated or comparator evidence is unavailable, invalid, or outside the frozen unit. | No verdict. Record the missing evidence and next feasible date. |
Table 12.1. Six-state adjudication machine. Temporal gating occurs before endpoint precedence; missing evidence outranks all substantive verdicts, and overlapping support/null evidence is mixed.
Decision precedence and event-to-hypothesis aggregation
Every qualifying event receives its own immutable event ID, trigger date, comparator, evidence state, endpoint and six-state verdict. Event results are never averaged into a systemic score. The rules below determine when several events are enough to say something about a general hypothesis rather than one case.
| Level | Frozen rule | Permitted conclusion |
|---|---|---|
| Single event | Apply the hypothesis Boolean rule once at the fixed endpoint. Report support, null, mixed/indeterminate, or not adjudicable. | A result about that event only. |
| Canonical H3A case | SpaceX-Cursor remains a permanent record: completed-success, completed-failure, blocked, abandoned, delayed, mixed, or not adjudicable. | The case cannot be erased by substituting a later deal. |
| Replicated event hypotheses | For H1A, H1B, H2, H3B and H4: require >=3 adjudicable events from >=2 firms, projects or regions. Support requires >=60% support and <=20% null; null requires the mirror image. Otherwise mixed. | General mechanism support or null only after minimum replication. |
| Panel hypotheses | H5-H7 use one pre-registered panel endpoint. Annual snapshots are window-open observations. A later independent panel is a replication, not pooled evidence. | A panel verdict at the specified endpoint. |
| Missing and mixed evidence | Report all triggered events. If >50% are not adjudicable, no hypothesis-level verdict is issued. Mixed events remain in the ledger but outside support/null shares. | Evidence insufficiency cannot be hidden by the available subset. |
Table 12.1A. Event verdicts and hypothesis-level conclusions are separate layers of the protocol.
| Hypothesis | Trigger, unit, horizon and data | Support rule | Null, mixed and missing-data rule |
|---|---|---|---|
| H1A issuer shock | Material AI-system issuer falls >=20% over <=20 trading days without a qualifying common-substrate event; +60 trading days. Market, TRACE/CDS, fund, clearing and regulatory data. | Credit spread widens >=75 bp versus synthetic control AND either: short-term funding spread widens >=50 bp or collateral haircut rises >=5 pp; OR forced sales reach >=0.5% of free float in 5 days or clearing margin rises >=25%. | Null: credit <25 bp, funding <20 bp, haircut <2 pp, forced sales <0.1% and clearing margin <10%. Both support and null -> mixed. Not adjudicable if exposed-intermediary mapping is unavailable. |
| H1B common substrate | Foundry, HBM, packaging, interconnect, platform-security or power shock affecting >=3 material AI-system issuers; +120 trading days. | At least 3 issuers show >=10% production/capacity/revenue-guidance impact or >24-hour critical service loss AND relevant index falls >=15% AND credit/funding widens >=50 bp versus unaffected controls. | Null: operating shock occurs, but credit/funding stays <25 bp and no core-market disruption. Missing issuer exposure map -> not adjudicable. |
| H2 infrastructure finance | Cancellation, delay or utilization failure for project >=1 GW or $10B; 24 months. Project, utility, lender, municipal and supplier data. | Lender/project loss >=5% of committed principal OR both utility/ratepayer cost >=2% and exposed supplier revenue loss >=10%. | Null: >=80% of failed nameplate MW or committed capital is re-contracted within 24 months at >=80% of original contracted economics, while creditor/rate effects stay below half the support thresholds. Not adjudicable without financing and replacement-customer maps. |
| H3 integration | Completed stock-financed application acquisition >=1% of acquirer market cap; 12 and 24 months. Cohort, product, accounting and market data. | Retention no more than 5 pp below neutral comparator AND neutrality deterioration <10 pp AND impairment <10% of purchase consideration AND either 24-month ROIC >= WACC or verified operating improvement >=10%. | Null: ROIC <= WACC-5 pp OR two of retention loss >15 pp, neutrality deterioration >=20 pp, impairment >=10%, or operating underperformance. Blocked/abandoned H3A remains recorded; H3B may use later qualifying deals. |
| H4 power-latency | Matched sites/workloads over four quarters after >=25% increase in service-level-compliant task demand or agentic depth. Demand and supply are accelerator-equivalent compute-hours at a frozen workload mix. | Required compute-hour demand growth exceeds efficiency improvement by >=15 pp AND P95 latency or SLA miss rate worsens >=20% AND constraint appears at >=2 sites. | Null: compute-hours per verified task improve >=20%, P95/SLA worsens <=5%, and commissioned SLA-capable compute-hours meet >=90% of demand growth. Not adjudicable without workload and site telemetry. |
| H5 hyperscaler intermediation | Stratified panel of >=30 enterprise contracts across >=3 sectors; no provider >40% of sample; annual endpoint through 2030. | At least 2 of 3: hyperscaler receives >=60% of total AI platform/model/cloud spend; owns master contract/control plane in >=60% of deployments; model substitution occurs without customer contract change in >=40%. | Null: at least 2 of 3 remain below 35%. Mixed between thresholds. Not adjudicable if recruitment, spend denominator or contract access fails. |
| H6 managed sovereignty | Dependency shock or exit test in >=20 pre-selected critical workflows with affected/unaffected matches; 12 months. | Fallback meets frozen output-quality and security tolerance in >=80% of workflows, median RTO improves >=30%, and fully loaded TCO premium <=15% versus single-provider control. | Null: fallback success <40% and RTO improves <10%; TCO remains reported separately. Mixed otherwise. Not adjudicable without tested failover, RTO and cost data. |
| H7 open-weight rents | Matched production-workload and layer-spend panel through 2030. Production share is compute-weighted verified tasks; secure task cost uses the same workload and service level. | At least 3 of 4: open-weight production share >=30%; secure task cost <=90% of closed comparator; closed-model price premium falls >=25%; adjacent-layer share of AI spend/gross profit rises >=10 pp. | Null: production share <10%, closed premium decline <5%, adjacent-layer shift <3 pp, and secure task cost remains >110% of closed comparator. Mixed otherwise; not adjudicable without matched workload and layer-spend data. |
Table 12.2. Executable H1A, H1B and H2-H7 rules. Thresholds are frozen protocol choices, not natural constants.
Frozen measurement units and denominators
The terms below close the remaining dimensional gaps. A future review may revise a threshold prospectively, but it may not change the unit or denominator after an event is known.
| H | Frozen unit or denominator | Completed variable definition | Mandatory evidence |
|---|---|---|---|
| H1A | Issuer and exposed-intermediary spread change versus synthetic control | Funding breach, collateral haircut, forced-sale share of free float, and clearing-margin change each have numeric thresholds. | Issuer debt/CDS, dealer/fund flows, collateral and clearing data. |
| H1B | Common event across >=3 material AI-system issuers | Operating impact means >=10% capacity/production/revenue-guidance change or >24-hour critical service loss. | Supplier exposure, issuer operations, index and credit controls. |
| H2 | Failed MW or committed capital and replacement economics | Redeployment is >=80% re-contracted at >=80% of original economics within 24 months. | Original and replacement contracts, creditor, utility and supplier maps. |
| H3 | Deal-date value of issued shares and post-close operating cohorts | Material impairment is >=10% of consideration; ROIC includes issued equity at deal-date value; neutrality is measured by availability, defaults, price and overrides. | Cohort retention, model mix, accounting and integration cost. |
| H4 | Accelerator-equivalent compute-hours at frozen workload mix and SLA | Demand, efficiency and commissioned supply share one unit; latency is P95 and SLA miss rate. | Site telemetry, workload depth, compute-hours and commissioned capacity. |
| H5 | Total contracted AI platform/model/cloud spend in a stratified contract panel | Provider, sector and spend denominators are frozen before recruitment; model substitution is measured without customer contract change. | Contracts, invoices, control-plane ownership and routing changes. |
| H6 | Twenty pre-selected critical workflows | Fallback success requires output, security, RTO and recovery-point tolerance; TCO includes integration and standby cost. | Executed exit tests, logs, costs and matched controls. |
| H7 | Compute-weighted verified tasks and matched fully loaded task cost | Open-weight share, closed premium and adjacent-layer rent shift use one frozen workload/spend panel. | Production logs, prices, security cost, human review and layer economics. |
Table 12.2A. H1-H7 measurement units, denominators and required evidence.
Hypothesis-specific scenario generator
To expose how support-side assumptions interact before sufficient data exist, v1.2.1 retains a simplified Monte Carlo support-pattern generator modeled on the transparency discipline of the When We Crash working paper, not on its parameters or reported probabilities. For each hypothesis, it samples the disclosed component probabilities, generates correlated Bernoulli outcomes, and applies the fixed support Boolean pattern. The generator is conditional on a qualifying event and complete measurement. It does not estimate event incidence, null probability, public observability, or the chance of a not-adjudicable verdict. Those belong to the real-world event ledger (When We Crash 2026).
Frozen implementation: random seed 20260724; 200,000 base trials per hypothesis; base within-hypothesis equicorrelation 0.35; 400 sensitivity batches of 4,000 trials; correlation varied from 0.10 to 0.60; component probabilities sampled from the low/mode/high ranges in Table 12.3. The simulation evaluates support patterns only, so it contains no support-versus-null precedence rule and cannot output "not adjudicable." Real-world endpoint precedence is governed by Table 12.1.
| H | Component priors: low / mode / high | Support Boolean pattern |
|---|---|---|
| H1A | Credit 0.10/0.25/0.45; funding/collateral 0.05/0.15/0.35; flow 0.15/0.35/0.60. | Credit AND (funding OR flow). |
| H1B | Multi-issuer operating 0.35/0.60/0.82; index 0.25/0.50/0.75; credit 0.08/0.22/0.45. | Operating AND index AND credit. |
| H2 | Lender 0.20/0.40/0.65; utility 0.15/0.30/0.55; supplier 0.20/0.45/0.70. | Lender OR (utility AND supplier). |
| H3 | Retention 0.45/0.65/0.82; neutrality 0.40/0.65/0.85; ROIC 0.25/0.45/0.65; operating 0.30/0.55/0.75; no impairment 0.70/0.85/0.95. | Retention AND neutrality AND no impairment AND (ROIC OR operating). |
| H4 | Demand>efficiency 0.45/0.65/0.85; latency/SLO 0.20/0.40/0.65; multi-site 0.25/0.50/0.75. | All three. |
| H5 | Spend 0.45/0.65/0.80; contract 0.40/0.60/0.78; channel/margin 0.35/0.55/0.75. | At least two of three. |
| H6 | Portability 0.25/0.45/0.65; RTO 0.20/0.40/0.60; TCO 0.30/0.55/0.75. | All three. |
| H7 | Share 0.30/0.50/0.70; cost 0.30/0.55/0.75; premium 0.40/0.60/0.80; rent shift 0.35/0.55/0.75. | At least three of four. |
Table 12.3. Frozen component-prior ranges and Boolean support patterns for the illustrative scenario generator.
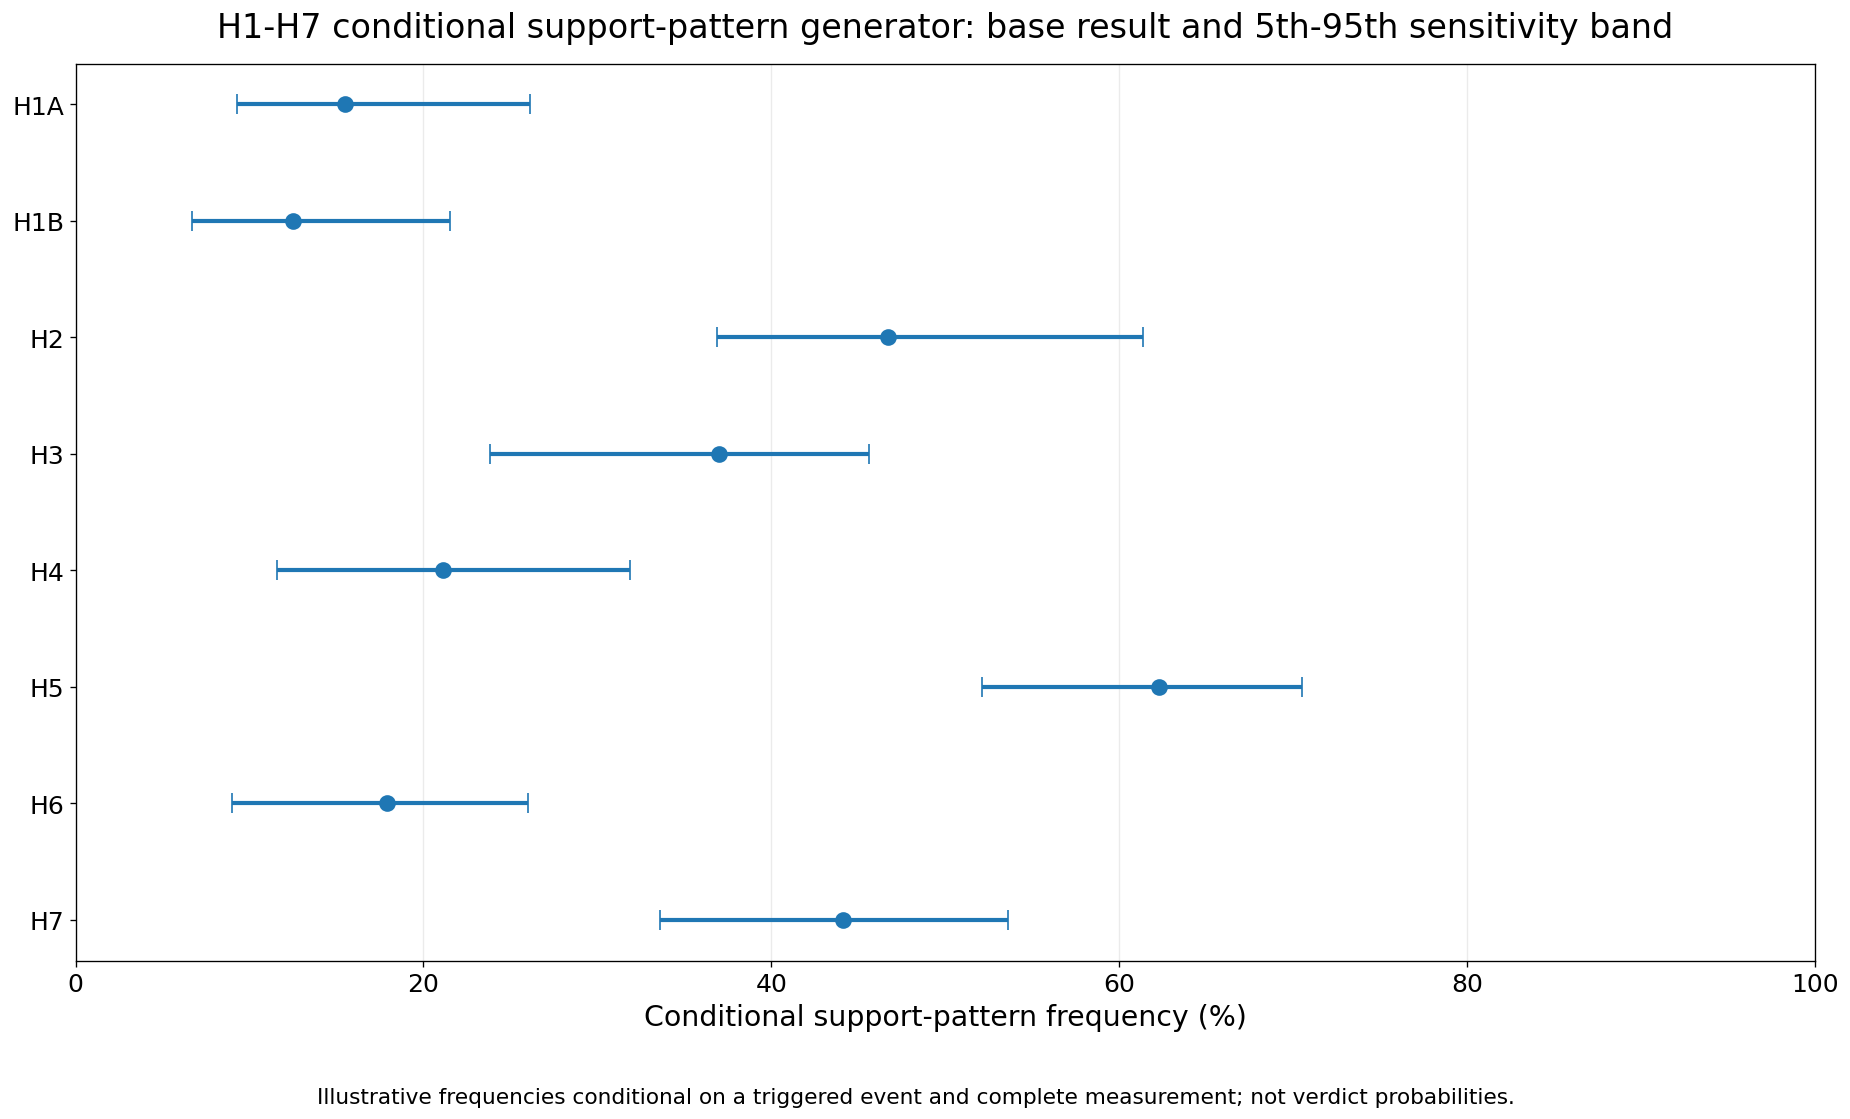
Figure 12.1. Conditional support-pattern frequency and 5th-95th sensitivity band. These are assumption-driven scenario outputs, not calibrated probabilities or a cross-hypothesis score.
| H | Base conditional support | 5th-95th sensitivity band | Null / missing simulated? | Interpretation |
|---|---|---|---|---|
| H1A | 15.5% | 9.3%-26.1% | No | Conditional on trigger and complete measurement. |
| H1B | 12.5% | 6.7%-21.5% | No | Conditional on trigger and complete measurement. |
| H2 | 46.7% | 36.9%-61.4% | No | Conditional on trigger and complete measurement. |
| H3 | 37.0% | 23.8%-45.6% | No | Conditional on trigger and complete measurement. |
| H4 | 21.1% | 11.6%-31.9% | No | Conditional on trigger and complete measurement. |
| H5 | 62.3% | 52.1%-70.5% | No | Conditional on trigger and complete measurement. |
| H6 | 17.9% | 9.0%-26.0% | No | Conditional on trigger and complete measurement. |
| H7 | 44.1% | 33.6%-53.6% | No | Conditional on trigger and complete measurement. |
Table 12.4. Conditional support-pattern outputs. These frequencies assume a triggered event and complete measurement; they are not verdict probabilities.
Historical applicability and rule-coverage audit
The historical exercise is not a backtest. It does not compute detection rates, lead time, false positives, precision or sensitivity. It asks only whether selected past episodes expose useful channel analogs and false comparisons for the current rules. The episode set is selected rather than exhaustive, so no predictive-performance claim is permitted. A genuine backtest would require a frozen episode universe, negative windows, dated proxies, complete decision rules and scored outcomes before results are inspected (When We Crash 2026).
| Episode | Channel analog | Protocol lesson |
|---|---|---|
| LTCM 1998 | Funding, leverage, counterparty and liquidity transmission. | A credit/funding rule should detect intermediary stress even when the originating asset is not a material AI-system issuer. |
| Dot-com 2000-02 | Equity concentration, telecom/fiber overbuild and capex reset. | Technology value can survive while securities and projects fail; H1A and H2 must remain separate. |
| Global financial crisis 2008 | Runnable funding, collateral and core intermediary failure. | Benchmark for hard financial-system transmission; an equity loss alone should not satisfy the rule. |
| Europe 2011 | Sovereign-bank credit loop. | Common macro shock requires controls; do not mislabel it as one issuer's effect. |
| Q4 2018 | Fast equity correction with limited systemic spillover. | Useful null analog for H1A. |
| COVID-19 2020 | Exogenous common operational and market shock. | Tests common-shock exclusion and the need to separate source from transmission. |
| 2022 cycle | Rates, valuation compression and financing repricing. | Tests whether spreads and project stress exceed broad rate controls. |
| August 2024 | Short, fast market shock. | Tests whether windows and duration filters avoid treating every drawdown as systemic. |
Table 12.5. Selected historical analogs provide rule coverage and false-analogy checks; they are not a backtest.
Backtest readiness by hypothesis
v1.2.1 freezes what can and cannot be tested historically. The first true backtest should be published as a separate workpaper rather than inferred from this narrative audit.
| Hypothesis | Historical backtest status | Reason |
|---|---|---|
| H1A / H1B | Partially feasible; not performed here | Market and credit proxies exist, but issuer and substrate exposure maps require a frozen sample and event dates. |
| H2 | Partially feasible; not performed here | Telecom, energy and data-center overbuild analogs exist; project guarantees and redeployment economics are often private. |
| H3 | Not comparable enough | Modern stock-financed frontier-model/application integrations lack a stable historical peer set. |
| H4 | Not currently feasible | No consistent historical panel links agentic workload depth, compute-hours, power, latency and SLA outcomes. |
| H5-H7 | Not currently feasible | Comparable enterprise contracts, exit tests, production model share and layer-rent panels do not exist historically. |
Table 12.5A. Backtest readiness is reported separately from historical narrative coverage.
The leading indicators
Leading indicators change before financial statements reveal the outcome. They include monthly concentration ranges, lockup and vesting supply, interconnection milestones, project finance, latency and sequential task depth, independent customer cash, production conversion, cloud-router share, stock-financed acquisition status, model neutrality, user retention, safety incidents, and environmental commitments. Announcements, confidential filings, signed deals, and pilot counts are states to monitor - not realized demand or confirmed mechanisms.
| Domain | Leading indicators | Interpretation |
|---|---|---|
| Capital markets | Float, lockup expiry, index eligibility, option skew, securities lending, follow-on issuance | Tests whether ownership and leverage are broadening faster than earnings support |
| Infrastructure | Interconnection milestones, transformer/turbine orders, customer deposits, construction progress, power contracts | Separates credible capacity from duplicated announcements |
| Hardware substrate | Productive fleet by accelerator and generation; HBM and advanced-packaging lead times; porting cost across CUDA, Neuron and CANN; commissioned racks; qualified capacity by geography | Tests whether model competition reduces dependence or merely relocates concentration to chips, software, fabrication, packaging and facility design |
| Commercial | Production deployments, renewal, workflow volume, outcome contracts, independent customer cash | Distinguishes adoption and willingness to pay from pilots and strategic financing |
| Technical | Cost per successful task, reliability, human escalation, context length used, model routing | Shows whether capability becomes economical work |
| Enterprise architecture | Multi-model control planes, private inference, exit tests, retained logs and evaluations | Measures bargaining power and operational substitutability |
| Open ecosystem | Open-weight production share, matched secure task cost, deployment time, model-layer price and concentration, license rights, and margin by adjacent layer | Tests whether openness broadens diffusion and switching or merely shifts value and dependency to the substrate |
| Labor | Entry-level hiring, job redesign, training hours, wage distribution, AI-related performance monitoring | Reveals transition before aggregate employment changes |
| Geopolitics | Export licenses, domestic chip substitution, regional model mandates, allied compute projects | Shows whether the market is integrating or fragmenting |
| Vertical integration | Stock-financed deal value, implied dilution, application ownership, default model share, interoperability, and user retention | Tests whether market value is becoming industrial power and whether acquisitions create operating value rather than only narrative scale |
Table 12.6. Leading indicators for quarterly monitoring.
The coincident indicators
Coincident indicators describe the operating state: energized megawatts, utilization, successful tasks per kWh, P95/P99 latency compliance, gross margin after depreciation and power, workflow volume, agent success and rollback, model mix, retention, direct versus intermediary billing, exit-test performance, safety events, water and emissions intensity, and realized labor productivity. They must be segmented by workload and control layer.
The lagging indicators
Lagging indicators reveal whether the system-level thesis materialized: free cash flow, return on invested capital, defaults or restructurings, utility rate effects, pension and household wealth losses, aggregate productivity, labor share, regional employment, and the concentration of critical workflows. By the time these appear, strategic options may be narrower. Their value is calibration: they show which leading indicators were genuinely predictive.
Exploratory propositions and non-scored channel classification
The thesis no longer scores firms on a low-to-high composite systemic scale. Analysts classify evidence separately by hard financial transmission, macro-financial amplification, operational criticality, strategic importance, and resolvability. Broader propositions that lack thresholds or comparative data remain exploratory and carry less epistemic weight than the seven primary hypotheses.
| Exploratory proposition | Why it is not yet primary | Evidence needed | Downgrade or upgrade rule |
|---|---|---|---|
| E1. U.S.-China leadership remains layer-specific and multipolar. | "Persistent dominance" lacks a stable horizon and comparable weights across layers. | Five-year panel of secure task cost, capability, chips, packaging, power, deployment, trust, and third-market adoption. | Upgrade after thresholds are fixed; reject if one ecosystem dominates the pre-specified majority of weighted layers for the full horizon. |
| E2. Productivity depends on work design and institutions. | Firm heterogeneity is nearly guaranteed and does not identify the causal complement. | Matched business units using the same model with pre-specified redesign, training, quality, and output measures. | Upgrade if redesign treatment predicts durable incremental output; weaken if model capability alone explains results. |
| E3. Open weights improve distributed defense enough to offset irreversible capability and operating burden. | Comparable denominators for misuse, vulnerability discovery, patching, and deployment burden remain weak. | Matched open and closed deployments with incidents, severity, red-team coverage, time to detection and remediation, concentration outages, staffing, and scale. | Upgrade after comparable exposure-adjusted evidence; weaken if irreversible misuse or operational burden grows faster than defensive benefit. |
| E4. Model neutrality is a central application asset. | Neutrality lacks one universal threshold and varies by workflow. | Model availability, release timing, price, routing override, BYO credentials, context portability, retention, and counterfactual competitors. | Upgrade by application after pre-deal baselines; weaken where ownership improves value without restricting meaningful choice. |
| E5. Full-stack convergence generalizes beyond SpaceX. | Current evidence is concentrated in one extreme boundary case and company intent. | Comparable cross-layer acquisitions or organic moves by multiple independent firms, including failures and neutral alternatives. | Upgrade after repeated post-integration success; reject as a general pattern if the boundary case remains isolated. |
| E6. Frontier AI safety risk becomes economically load-bearing. | Severe misuse and control outcomes have uncertain probability and evolving measurement. | Capability, access, permissions, incidents, near misses, safety-case performance, insurance, release restrictions, and regulatory cost. | Upgrade when pre-specified risk thresholds affect deployment or finance; weaken if verified controls bound exposure as capability grows. |
| E7. Hardware-stack control predicts bargaining power and resilience independently of model quality. | Fleet allocation, effective pricing, utilization, porting effort, yield and package capacity are largely private and platform claims are not normalized. | Eight-quarter panel across at least three accelerator ecosystems: productive share, matched task goodput/MW, effective cost, porting time, HBM and package lead time, uptime, and facility conversion. | Upgrade after thresholds and matched workloads are fixed; weaken if hardware platform and geography cease to predict cost, deployment speed, continuity, or margin after model quality is controlled. |
Table 12.7. Exploratory propositions are separated from primary hypotheses rather than given a composite score.
Evidence standards
Separate project status: Record announced, contracted, financed, under-construction, energized, utilized, and profitable capacity as different states.
Tag the evidence: Distinguish observed, prospective, and conjectural claims; a filing, signed merger, or management rationale is not a completed operating result.
Separate source from result: Use company claims as evidence of strategy or disclosed scale, then seek customer, regulator, audited, or independently observed confirmation.
Pre-register the test: Record the unit, horizon, baseline, counterfactual, metric, and disconfirming result before the event matures.
Measure workflows, not models alone: Include tools, data, permissions, retries, human review, service levels, and downstream outcomes.
Keep value, rescue, and disconfirmation distinct: Separate social value from investor return and continuity support from shareholder rescue; every review must record evidence that weakened the thesis.
Source symmetry: For every load-bearing source, record supportive, neutral, and disconfirming observations contained in that source. A relevant item excluded from the body must have a stated scope or relevance reason. Appendix D is the baseline ledger.